Private browser hardware diagnostics

Screen Resolution & Display Info

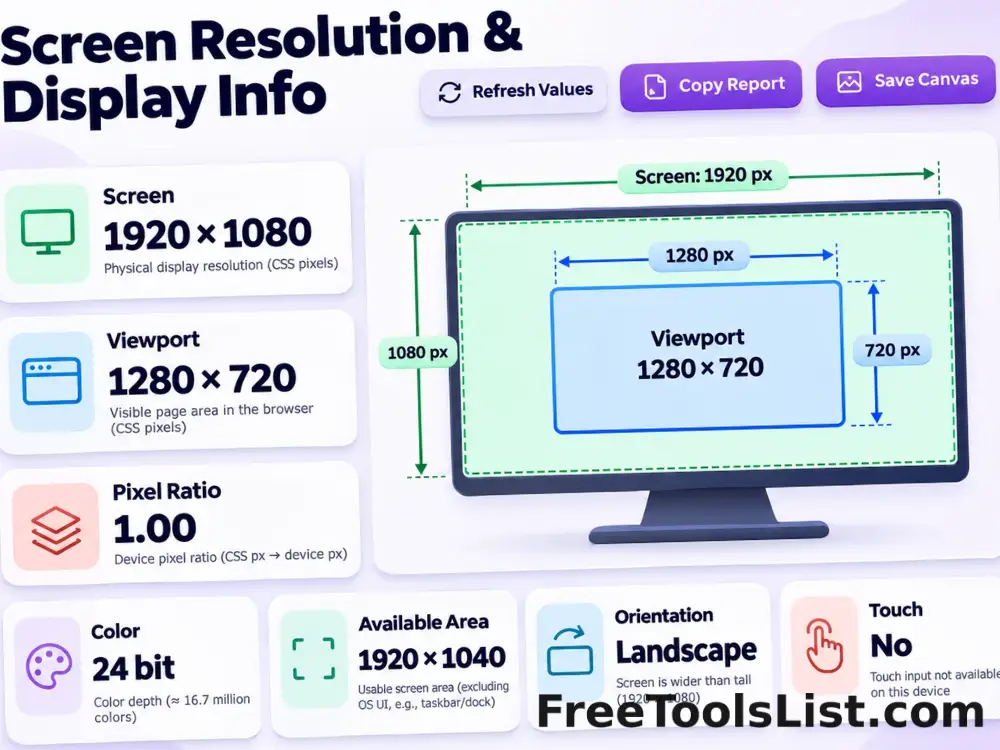
Report physical screen size, available area, viewport, device pixel ratio, color depth, orientation and touch capability.

● Local diagnostics · Live preview · No account

Screen Resolution & Display Info workspace

Run the focused test, inspect the live canvas and save only a result you have reviewed.

Browser local

Loading diagnostic workspace…

Quick Tool Overview

Screen Resolution with clear visual feedback.

Report physical screen size, available area, viewport, device pixel ratio, color depth, orientation and touch capability.

Use this focused utility to capture browser-visible display metrics for diagnostics and support. Inputs, measurements and the visual canvas stay together in one compact workspace.

LIVECanvas feedback
RESFocused diagnostic
LOCALPrivate processing
0Accounts needed
Important limitation. Browser zoom, display scaling and privacy protections can make CSS pixels differ from physical panel pixels.
About the Tool

What Screen Resolution & Display Info does.

Primary purpose

Use it to capture browser-visible display metrics for diagnostics and support.

Browser-native method

The page uses available browser input, media, display, canvas, Web Audio or WebGL APIs instead of a remote diagnostic service.

Live visual surface

Events, waveforms, patterns, page layouts or performance remain visible while the settings change.

Private workflow

Ordinary test data remains in browser memory. Media permission is requested only after you press a relevant start button.

Explicit saving

No result is uploaded or saved automatically. Canvas and report downloads happen only when you choose them.

Known limitation

Browser zoom, display scaling and privacy protections can make CSS pixels differ from physical panel pixels.
Key Features

Modern, compact hardware testing.

◎

Purpose-built controls

Only settings relevant to this diagnostic are shown.

◫

Live canvas

Watch input, timing, patterns or output before saving.

⌂

Local processing

Testing happens in the current browser tab.

↓

Reviewed export

Save a canvas or text report only when available and approved.

How to Use Screen Resolution & Display Info

Complete the diagnostic in six clear steps.

Review compatibility

Open Screen Resolution in a current browser and read the capability message before starting the diagnostic.

Step 1: Keep conditions consistent when comparing runs.

Choose the focused settings

Select the test mode, duration, device, pattern or page options that match the hardware question you need to answer.

Step 2: Keep conditions consistent when comparing runs.

Start the local test

Use the primary control and interact with the screen resolution workspace as instructed. Device permissions are requested only when the feature requires them.

Step 3: Keep conditions consistent when comparing runs.

Watch the live canvas

Review visual events, levels, timing, traces, page composition or performance as the test runs.

Step 4: Use the visible canvas to verify what the browser received.

Compare the reported metrics

Check the result cards and canvas together. Browser zoom, display scaling and privacy protections can make CSS pixels differ from physical panel pixels.
Step 5: Keep conditions consistent when comparing runs.

Save or repeat intentionally

Download the reviewed canvas or report when available, or reset and repeat under the same conditions for comparison.

Step 6: Keep conditions consistent when comparing runs.

Ready to test?

Run a local diagnostic with visible feedback.

No sign-up, remote queue or automatic saving.

Open Screen Resolution →

Frequently Asked Questions

Popular screen resolution questions.

No. Input events, canvas drawing and ordinary diagnostic calculations stay in this browser tab. Microphone and camera access use the browser permission system.

Yes. Every page includes a live canvas or visual diagnostic surface, and downloads are explicit.

Use a current desktop or mobile version of Chrome, Edge, Firefox or Safari. Individual hardware APIs vary by browser and device.

Browser zoom, display scaling and privacy protections can make CSS pixels differ from physical panel pixels.

No. It is a practical browser diagnostic. Certified measurement, repair or calibration requires appropriate hardware and expertise.

No. The test is available locally without registration or a remote processing queue.

Keep exploring

Similar Tools

Continue with related free tools selected from this category and the wider directory.

20 tools
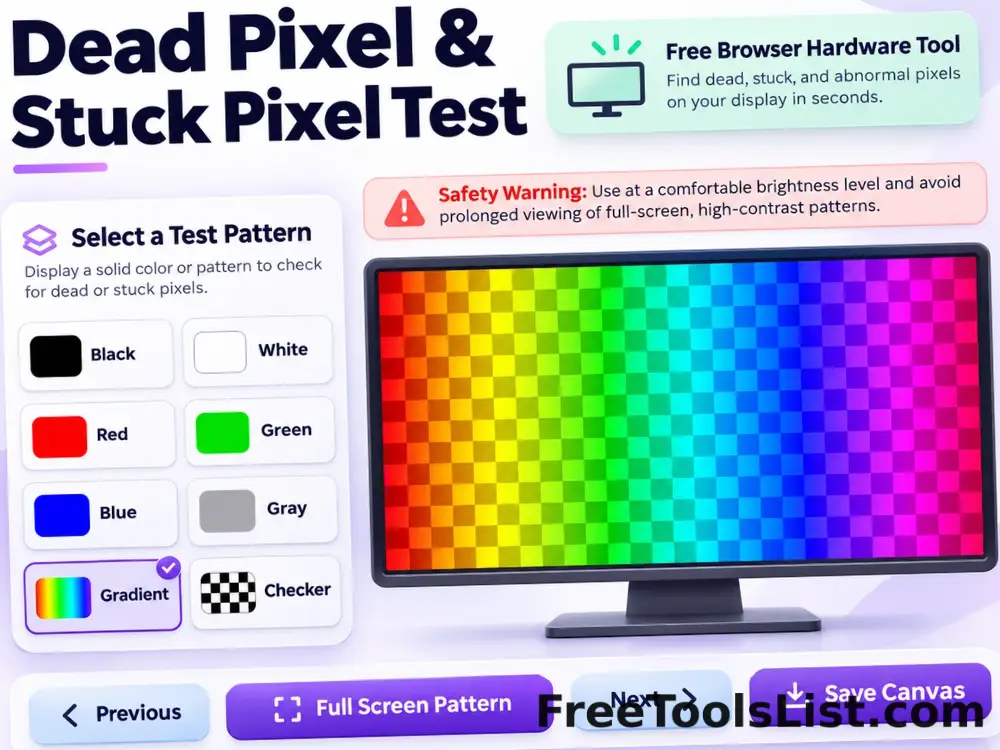
Dead Pixel & Stuck Pixel Test tool previewDPHardware Tests

Dead Pixel & Stuck Pixel Test

Cycle fullscreen solid colors, gradients and checkerboards to inspect dead, stuck or uneven display pixels with an optional flashing pattern warning.

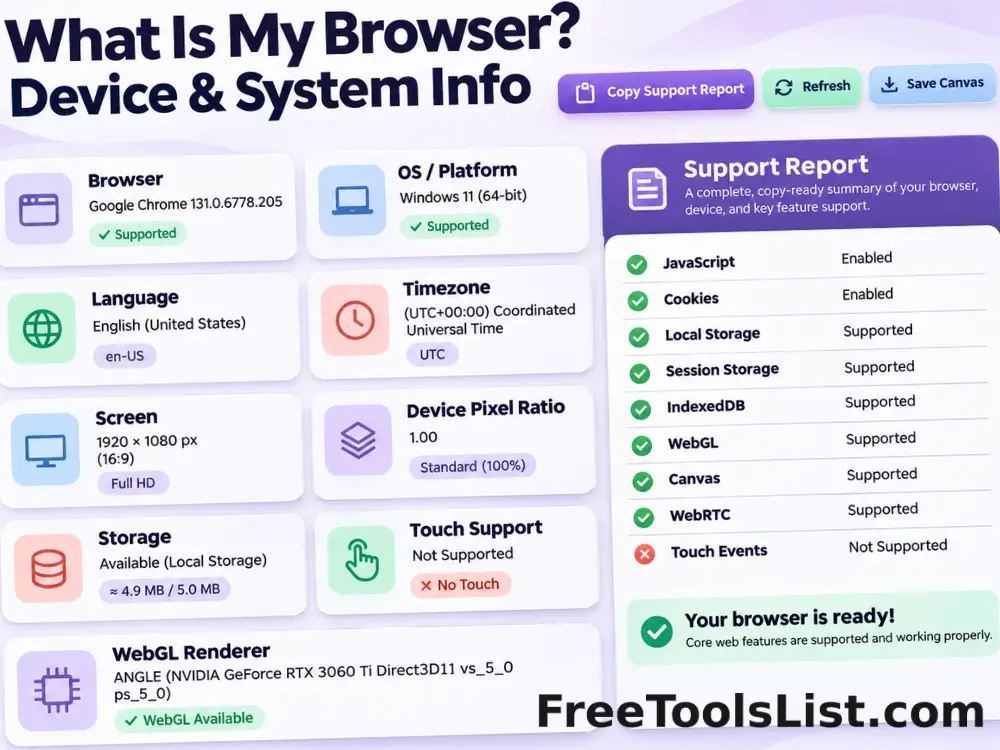
What Is My Browser? Device & System Info tool previewWIHardware Tests

What Is My Browser? Device & System Info

Identify browser, operating system, language, timezone, display, storage, touch and WebGL renderer details and copy a support-ready report.

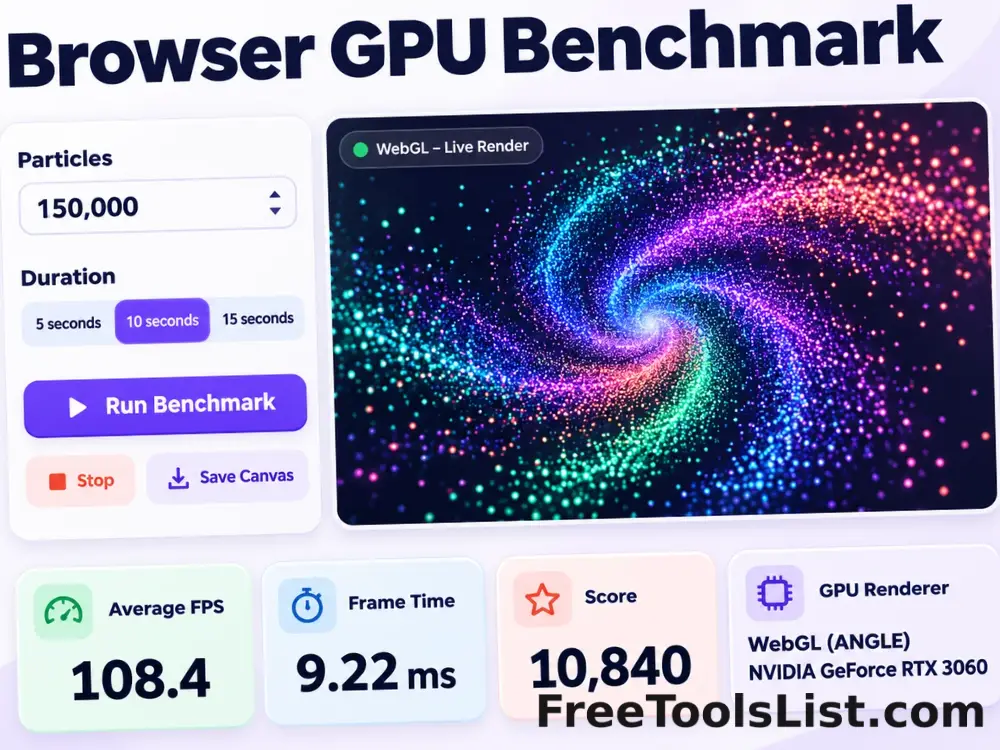
Browser GPU Benchmark tool previewBGHardware Tests

Browser GPU Benchmark

Run a timed WebGL particle stress test with adjustable workload, resolution scale, FPS and frame-time reporting.

Monitor Calibration Test Patterns tool previewMCHardware Tests

Monitor Calibration Test Patterns

Preview black and white levels, gamma, grayscale, RGB gradients, sharpness and checkerboard patterns in a fullscreen canvas.

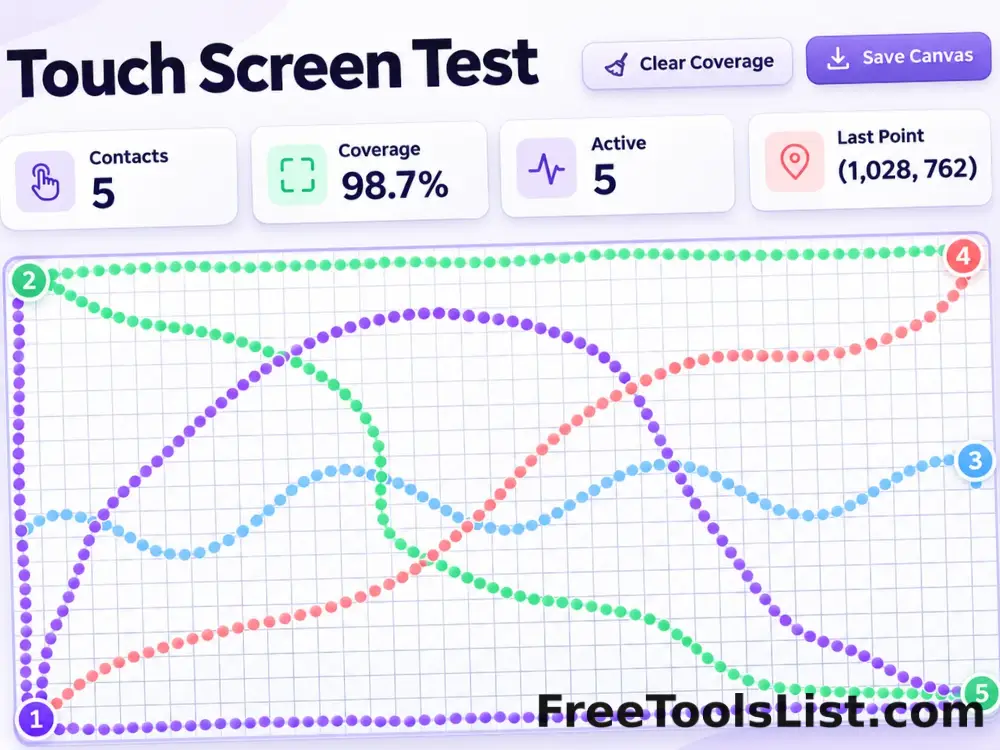
Touch Screen Test tool previewTSHardware Tests

Touch Screen Test

Inspect pointer contacts, multitouch count, edge coverage and possible dead zones with a full interactive grid canvas.

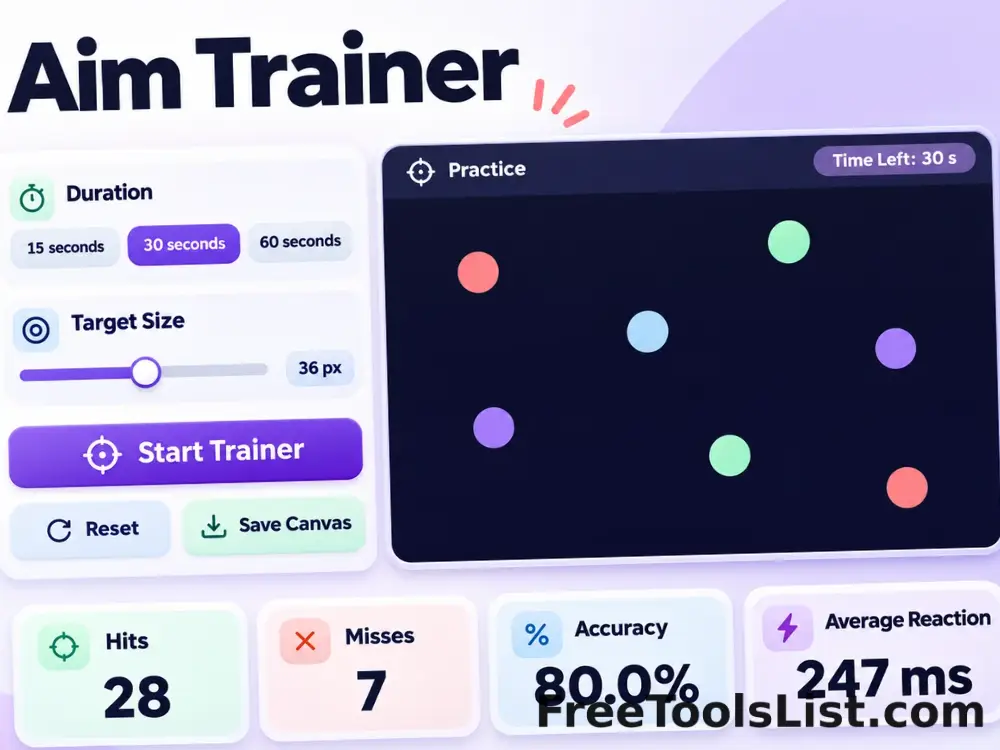
Aim Trainer tool previewATHardware Tests

Aim Trainer

Practice target acquisition with adjustable duration and target size while tracking hits, misses, accuracy and average reaction time.

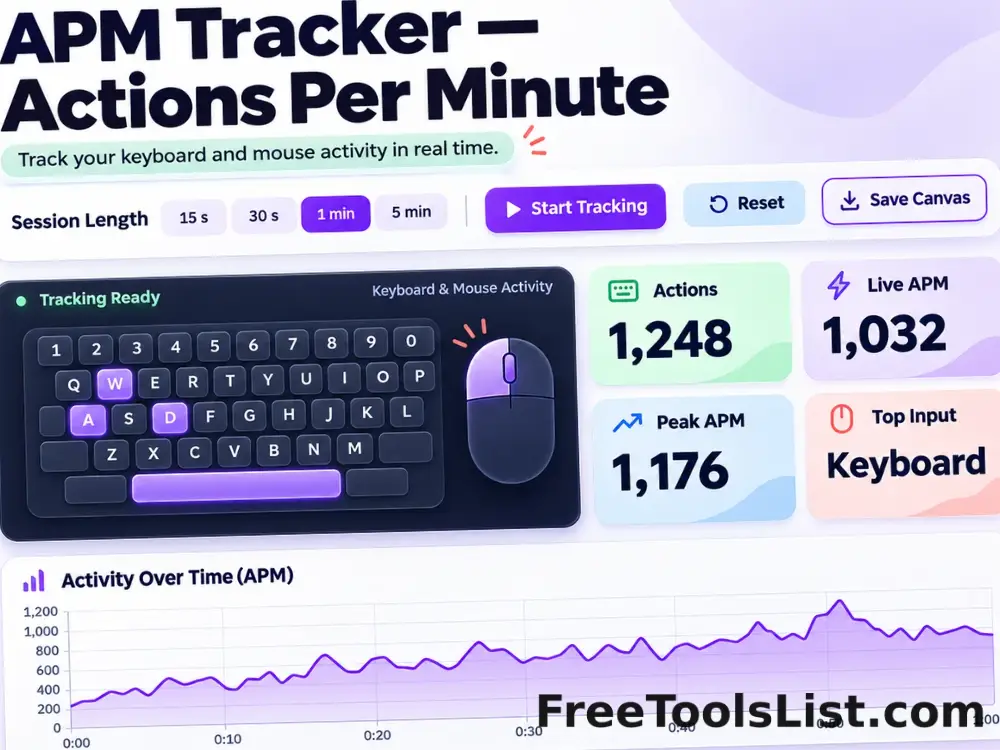
APM Tracker — Actions Per Minute tool previewATHardware Tests

APM Tracker — Actions Per Minute

Track keyboard and mouse actions, live and peak actions per minute, top keys and a time-series activity canvas.

Bass Test & Speaker Rattle Checker tool previewBTHardware Tests

Bass Test & Speaker Rattle Checker

Play controlled low-frequency tones, sweeps and pulse patterns to check speaker response, rattles and channel consistency.

Gamepad Tester tool previewGTHardware Tests

Gamepad Tester

Inspect connected gamepad buttons, analog axes, stick drift, dead zones and vibration support with live visual traces.

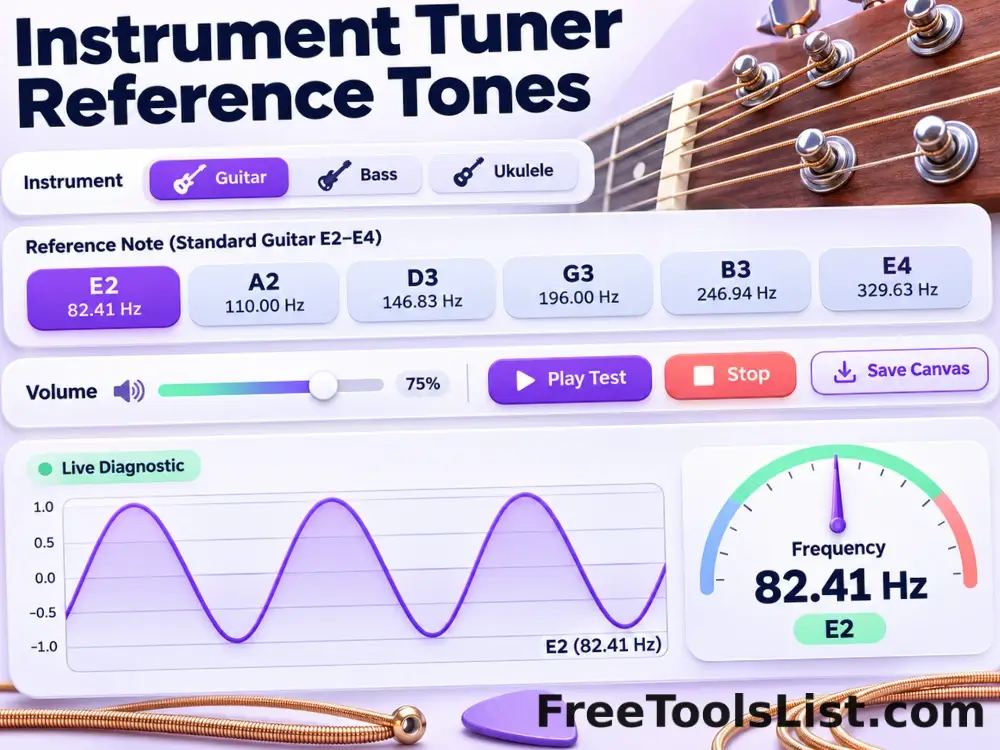
Instrument Tuner Reference Tones tool previewITHardware Tests

Instrument Tuner Reference Tones

Play exact guitar, bass and ukulele reference notes with alternate tunings, frequency labels and a visual waveform.

Keyboard Test & Key Rollover Checker tool previewKTHardware Tests

Keyboard Test & Key Rollover Checker

Test every keyboard key, active-key rollover, event latency, repeated-key chatter and recent input in a visual browser keyboard.

Microphone Latency & Echo Test tool previewMLHardware Tests

Microphone Latency & Echo Test

Estimate round-trip microphone latency with a generated tone, inspect waveform detection and optionally monitor a delayed local voice loopback.

Monitor Refresh Rate Test tool previewMRHardware Tests

Monitor Refresh Rate Test

Measure animation-frame timing, estimated refresh rate, frame time and dropped-frame variation with a live smoothness canvas.

Mouse Test & Pointer Diagnostics tool previewMTHardware Tests

Mouse Test & Pointer Diagnostics

Test mouse buttons, drag behavior, double-click timing, click speed, polling rate and scroll performance in one mode-based diagnostic canvas.

Online Microphone Test tool previewOMHardware Tests

Online Microphone Test

Select and test a microphone with a live waveform, level meter, device details, local recording, playback and reviewed audio export.

Print Blank Page tool previewPBHardware Tests

Print Blank Page

Create a truly blank A4, Letter or Legal page for paper-feed tests, roller cleaning and jam checks without consuming ink.

Printer Test Page Generator tool previewPTHardware Tests

Printer Test Page Generator

Generate CMYK, black-and-white, grayscale, alignment and photo-gradient diagnostic sheets with paper, orientation, margin, print and PNG controls.

Reaction Time Test tool previewRTHardware Tests

Reaction Time Test

Run repeated visual reaction trials, detect early clicks and review best, average, worst and consistency results on a canvas.

Room Noise Checker & Decibel Meter tool previewRNHardware Tests

Room Noise Checker & Decibel Meter

Monitor current, average and peak room noise with a 15-second waveform and a call-readiness rating processed locally.

Solid Color Page & Ink Flush tool previewSCHardware Tests

Solid Color Page & Ink Flush

Generate a solid cyan, magenta, yellow, black or custom-color printer page with paper, orientation, safe-margin and preview controls.

PublishedUpdated